
Average Calculator — Mean, Median, Mode and Range
The word “average” means different things in different situations. A teacher wants the mean of exam scores. A property analyst wants the median house price. A retailer wants the mode — the most common shoe size. This free average calculator finds all three simultaneously, along with the range, sum, count, minimum and maximum — with a full step-by-step solution for each.
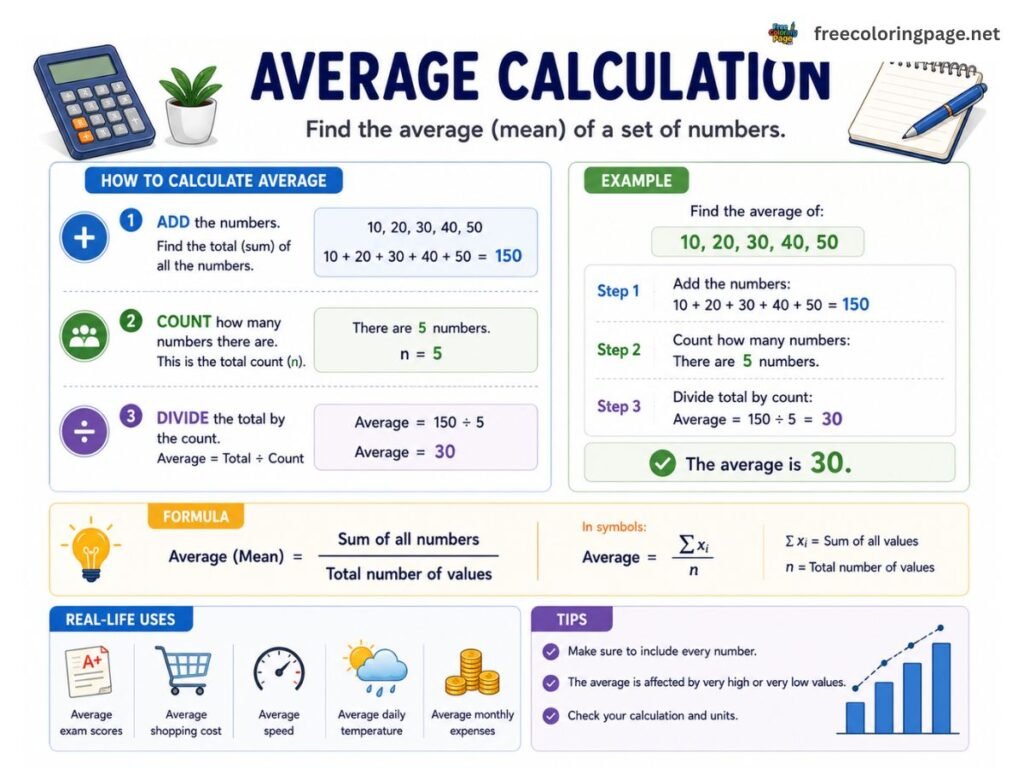
Mean — The Arithmetic Average
The mean is the sum of all values divided by the count of values. It is what most people mean when they say “average.”
Formula: Mean = Sum ÷ Count
Example: 10, 25, 38, 42, 15 Sum = 130 · Count = 5 · Mean = 130 ÷ 5 = 26
Use the mean when: your data has no extreme outliers — test scores, temperatures, prices of similar items.
Avoid the mean when: one extreme value distorts the picture. At a company where the CEO earns £2 million and ten employees earn £25,000, the mean salary is £200,000 — a number that represents nobody.
Median — The Middle Value
The median is the middle value when numbers are sorted from smallest to largest. For an even count the median is the average of the two middle values.
Odd count example: 5, 10, 15, 20, 100 Sorted: 5, 10, 15, 20, 100 · Median = 15
Even count example: 5, 10, 20, 100 Middle two: 10 and 20 · Median = (10 + 20) ÷ 2 = 15
The mean of the odd example is 30 — pulled up by 100. The median stays at 15. This is why house prices and salaries are always reported as medians — a few extreme values would make the mean meaningless.
Use the median when: your data has outliers or is skewed — house prices, salaries, income data.
Mode — The Most Frequent Value
The mode is the value that appears most often. A data set can have no mode, one mode or multiple modes.
Example: 3, 5, 5, 7, 8, 9, 9, 9 → Mode = 9 (appears 3 times)
Bimodal example: 2, 2, 5, 5, 8 → Mode = 2 and 5 (both appear twice)
Use the mode when: you want the most common value — most popular shoe size, most frequent exam score, most common survey response.
Range — How Spread Out the Data Is
Formula: Range = Maximum − Minimum
Example: 10, 25, 38, 42, 15 → Range = 42 − 10 = 32
The range is used alongside the mean. Two classes both averaging 70% on an exam tell different stories if one has a range of 10 (everyone scored similarly) and the other has a range of 60 (scores varied wildly).
Use the Percentage to GPA tab in the GPA calculator to convert instantly. This is particularly useful when applying to US universities from countries that use percentage grading system.
When to Use Mean vs Median vs Mode
|
Situation |
Best measure |
|---|---|
|
Exam scores, temperatures |
Mean |
|
House prices, salaries, income |
Median |
|
Most popular size, colour, response |
Mode |
|
Data with extreme outliers |
Median |
|
Symmetric data — bell curve |
Mean |
|
Skewed data — long tail |
Median |
Real example: The mean US household income in 2023 was approximately $105,000. The median was approximately $74,500. The mean is pulled up by very high earners — the median gives a more accurate picture of what a typical American household actually earns.
How to Calculate a Weighted Average
When values do not all count equally a simple average gives the wrong answer. Multiply each value by its weight, add the weighted values together and divide by the total weight.
Example — student course grade:
- Midterm exam: 65% — weight 30
- Final exam: 78% — weight 50
- Coursework: 90% — weight 20
Simple average = (65 + 78 + 90) ÷ 3 = 77.6% ❌
Weighted average = (65×30 + 78×50 + 90×20) ÷ (30+50+20) = 76.5% ✅
The final exam carries more weight so the result is pulled closer to 78% than to the coursework score of 90%. Use the Weighted Grade Average tab to calculate this automatically.
Other Free Tools
- Percentage Calculator — Percentage of a number, change and markup
- GPA Calculator — Grade point average on the US 4.0 scale
- Word Counter — Words, characters, sentences and reading time
- Random Number Generator — Pick random numbers, roll dice, flip a coin
Frequently Asked Questions
About This Average Calculator
This average calculator is part of CalcDaysTime — a free suite of date, time and maths tools. All calculations run entirely in your browser. No data is sent to our servers, stored or shared with anyone.
Disclaimer: Results are calculated from the numbers you enter. Always verify statistical calculations against your institution’s official records before using in academic submissions or reports.